


Strategy & Frameworks
What Is a Strategy Map?
A Strategy Map is a visual representation of an organisation's strategic objectives and the relationships between them. Rather than presenting strategy as a collection of separate ambitions, it shows how progress in one part of a business is expected to contribute to outcomes elsewhere. Organised around four core perspectives—Financial, Customer, Internal Processes, and Learning & Growth—the map helps explain how organisational capabilities, operational activity, customer outcomes, and financial performance fit together as part of one strategic narrative. This addresses a common problem in business planning. Organisations rarely lack goals, but they often struggle to explain how those goals depend on one another. A leadership team may want to grow recurring revenue, improve customer retention, accelerate delivery, strengthen management capability, and invest in better technology. Each objective may make sense individually, yet the strategy remains incomplete if nobody can explain why one objective should contribute to another. A Strategy Map brings those assumptions into view so that management can examine whether the logic of the strategy genuinely holds together.
The framework developed from the work of Robert S. Kaplan and David P. Norton, whose Balanced Scorecard broadened performance management beyond traditional financial measures. The University of Cambridge Institute for Manufacturing explains the Balanced Scorecard through four perspectives concerned with financial performance, customers, internal processes, and an organisation's capacity to learn and improve. As use of the scorecard developed, the relationship between those perspectives became increasingly important. Kaplan and Norton explored this further in their landmark Harvard Business Review article, showing how strategic objectives could be connected visually before organisations decided which measures should be used to monitor them. The Strategy Map therefore developed as more than another performance dashboard. Its purpose was to describe the strategy itself. Harvard Business School's interview with Robert Kaplan explains that a Strategy Map links objectives across the four perspectives to show both the outcomes an organisation seeks and how it intends to achieve them.
A classic Strategy Map places Financial objectives at the top. These express the economic outcomes the strategy is expected to support, which may include revenue growth, improved margins, stronger cash generation, productivity, or better use of assets. Immediately below sits the Customer perspective, where the organisation describes the outcomes it needs to create for its chosen customers. Depending on the strategy, these might include stronger retention, improved service, greater trust, increased perceived value, or growth within a particular customer segment. Beneath the Customer perspective, Internal Processes identifies what the organisation needs to improve or perform especially well in order to deliver those outcomes. This may involve reducing errors, accelerating product development, improving fulfilment, strengthening onboarding, shortening sales cycles, or increasing service reliability. Learning & Growth sits at the foundation of the map and covers the capabilities that make those process improvements possible. It can include employee knowledge, leadership, culture, information systems, technology, data, and wider organisational capability rather than simply staff training.
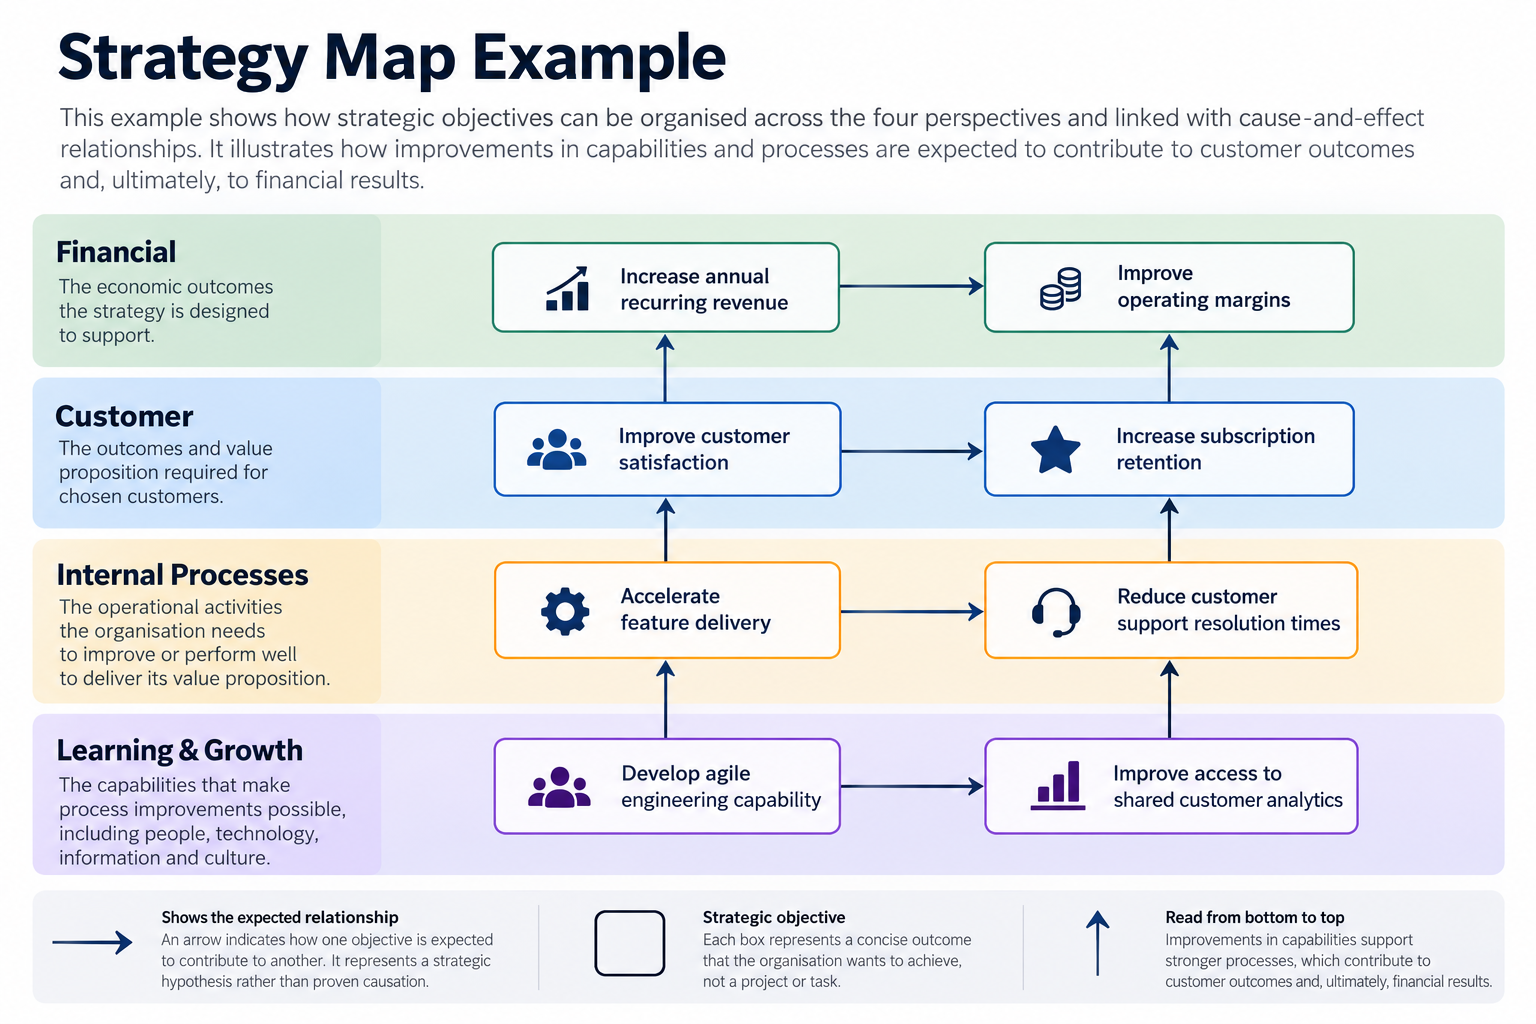
This example shows how objectives can be linked from Learning & Growth through Internal Processes and Customer outcomes to Financial results, creating a testable strategic hypothesis.
This bottom-to-top logic is one of the defining features of the framework. Learning and organisational capability support stronger internal processes; those processes are expected to create better customer outcomes; and those customer outcomes should, if the strategic assumptions are sound, contribute to financial results. The ICAEW's guidance on the Balanced Scorecard similarly distinguishes between the Strategy Map, which represents objectives and their cause-and-effect relationships, and the scorecard itself, which attaches measures, targets, and initiatives to those objectives. The arrows connecting objectives are therefore more important than the boxes themselves. They represent management's assumptions about how the organisation expects to create value. A software business, for example, might believe that improving product knowledge within its support team will reduce resolution times. Faster resolution may improve customer satisfaction, which could strengthen subscription retention and contribute to recurring revenue.
That sequence should be understood as a strategic hypothesis rather than proof of causation. The Project Management Institute describes Strategy Maps as a way of making these linked hypotheses explicit and testable. Because the organisation is moving toward a future state it has not yet reached, management is effectively stating what it believes will happen if particular capabilities and processes improve. The value of the map is that these assumptions become visible enough to challenge rather than remaining hidden inside a planning document. Independent academic research supports the usefulness of that visibility. A study available through Drexel University, published in the International Journal of Accounting Information Systems, examined how Strategy Maps affected performance evaluation using the Balanced Scorecard. Participants given a Strategy Map were more likely to recognise strategically linked measures and make evaluations consistent with the organisation's strategic objectives than participants who received strategy descriptions without the map. More recent peer-reviewed research published in Accounting & Finance also found that managers provided with a Strategy Map developed greater knowledge of the causal relationships represented in a strategy than those given narrative strategy information alone. The study is available through Wiley. These findings do not mean that a map makes a strategy correct, but they do support the idea that visualising relationships can help people understand the logic management is trying to communicate.
Building a useful Strategy Map begins with the strategy rather than the diagram. If leadership has not established its priorities, target customers, competitive direction, or intended value proposition, arranging objectives on a canvas will not resolve that ambiguity. Once the strategic direction is clearer, management can translate it into a limited set of objectives describing meaningful outcomes rather than individual tasks. For instance, strengthen data analytics capability describes a strategic capability, whereas purchase analytics software describes an action. Similarly, improve customer onboarding describes an outcome, while produce three onboarding videos is an initiative that might contribute to it. Keeping these distinctions clear prevents the Strategy Map from turning into a project plan.
Objectives can then be placed within the four perspectives and linked by asking what enables each objective and what higher-level outcome it is supposed to support. Management should be able to explain each connection in ordinary language. If the business cannot explain why a Learning & Growth objective should influence an Internal Process objective, or why an Internal Process objective should affect the customer, the connection deserves further thought. The map can also expose missing pieces. An objective sitting entirely on its own may be poorly defined, misplaced, unnecessary, or missing a supporting relationship. Likewise, a major financial objective with no customer or operational pathway beneath it reveals that management knows the result it wants but has not yet explained how the organisation intends to produce it. Research published in the Journal of Business Strategy on Strategy Maps from a middle-management perspective further illustrates that implementation matters and that maps should be revisited as assumptions, capabilities, markets, and priorities change rather than treated as finished diagrams.
Consider a fictional subscription software company preparing for its next phase of growth. Its leadership team establishes Financial objectives to increase annual recurring revenue and improve operating margins. To support those outcomes, it believes the business needs higher customer satisfaction and stronger subscription retention. Management then identifies two Internal Process objectives that may contribute to those customer outcomes: accelerating feature delivery and reducing customer-support resolution times. Beneath them, Learning & Growth objectives include strengthening agile engineering capability and improving access to shared customer analytics. The resulting map creates a strategic argument. Better customer analytics may provide support teams with faster access to account history, which could reduce resolution times. Faster resolution may improve customer satisfaction, which could contribute to retention and, over time, stronger recurring revenue. None of those links is guaranteed; the point is that leadership can now see the assumptions, decide whether they are credible, and select measures that will help test them.
Strategy Mapping can also work alongside other business frameworks rather than replacing them. A Gap Analysis may identify the distance between current performance and a desired future state, with some of those gaps becoming objectives on the map. A McKinsey 7S analysis may reveal capability, systems, leadership, or organisational issues that belong within Learning & Growth or Internal Processes. SigmaQu Porter's Five Forces can identify external competitive pressures that influence Customer or Financial objectives, while the SigmaQu Value Chain can reveal internal activities where efficiency, cost, or customer value may need attention. Findings from a SWOT analysis can likewise provide useful inputs when deciding which strategic objectives require attention. These frameworks perform different analytical tasks, but Strategy Mapping provides a way of bringing selected findings together into a coherent representation of what the organisation intends to change and why.
The Strategy Map is also distinct from the Balanced Scorecard itself. The map shows the objectives and the expected relationships between them, while the scorecard adds the performance-management structure used to monitor those objectives through measures, targets, and initiatives. A Strategy Map therefore addresses the question how do we believe the strategy works?, while the scorecard moves the discussion toward how will we know whether it is working? A Strategy Map also differs from a full Strategic Plan. A strategic plan may include competitive analysis, resources, implementation priorities, financial assumptions, risks, responsibilities, and measures of success. The map can provide a visual representation of the central strategic logic within that broader plan, but it does not contain every detail required to execute it. Research from City University London examining the use of the Balanced Scorecard and prototype Strategy Maps within a UK local government authority also illustrates that the underlying logic can be adapted beyond conventional shareholder-focused businesses. The four perspectives provide a useful structure, but they should not be treated as rigid categories that every organisation must apply in exactly the same way.
Within SigmaQu, the Strategy Map follows the classic four-perspective structure used throughout the Kaplan-Norton tradition. Users can define objectives within Financial, Customer, Internal Processes, and Learning & Growth, arrange them visually, and create links showing how those objectives are expected to influence one another. The map can then be reviewed for possible disconnected objectives, missing relationships, gaps, or inconsistencies. That analysis supports rather than replaces management judgement. Software can flag that an objective appears isolated or that an expected chain is incomplete, but it cannot prove that stronger employee capability will increase customer retention or that a particular process improvement will produce higher revenue. Those relationships remain strategic assumptions that leadership needs to evaluate against evidence.
The main strength of Strategy Mapping is therefore not that it simplifies strategy into a diagram, but that it requires the organisation to explain the relationships inside its strategy. A well-constructed map can help people see cross-functional dependencies, understand why particular capabilities deserve investment, and distinguish strategic objectives from the initiatives intended to achieve them. Its limitations follow from the same feature. A neat arrow can create a false sense of certainty, complex organisations may have feedback loops and external dependencies that do not fit neatly into a four-layer hierarchy, and adding every operational priority can make the map unreadable. An attractive visual design can also disguise weak strategic reasoning if the underlying objectives and relationships have not been challenged properly.
For this reason, a Strategy Map is best treated as an evolving representation of strategic thinking rather than a finished picture. Objectives may change, links may need to be challenged, and evidence may show that an assumed relationship is weaker or different from what management expected. Used well, the map provides a disciplined way to make those assumptions visible, connect strategic objectives across the organisation, and test whether the story being told about how the strategy will work is coherent. Its value comes from making management explain the logic between capability, process, customer outcome, and financial performance clearly enough that others can understand it, question it, and improve it.